![]()
Michael J Chapman, CFP
Phone: (317) 705 1999
FAX: (317) 705 1994
Winter 2023 Client Letter
Dear Valued Client,
2022 was a pivotal year in financial markets:
- Failure of the traditional 60% / 40% investment model (Stocks/Bonds)
- Start of a bear market in stocks
- End of 40-year bear market in bond yields (Dramatic rise in rates)
- Confirmation / Validation of PCM’s tactical, rules-based approach to investing
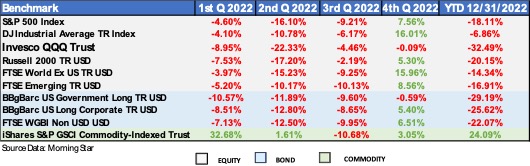
Failure of the traditional 60% / 40% (Stock/Bonds) investment model: Remember, as interest rates rise, bonds and bond funds decline. In 2022, the US long Government and Corporate bond indexes were down 29% and 25%. In 2022 both stocks and bonds were down significantly, leaving investors using a traditional Global 60/40 model down 21%. (60% equally weighted Equity, 40% equally weighted Bond from above indexes)The only asset class that was up for the year was Commodities. (See Index chart above).
Start of a bear market in stocks: In my Spring 2022 Client letter I suggested, “The first quarter of 2022 may have been the start of a bear market.” This now appears even more likely as the S&P 500 and the NASDAQ 100 closed the year down 18% and 32% respectively. I use the word “Start” because the relatively mild decline so far, has some pundits suggesting that this is a sign of “resilience”. However, because we are coming from the most speculative level of valuations in U.S. history, I share John Hussman’s position which is,
“Despite being nearly a year into what we expect to be a far deeper retreat, the relatively shallow loss isn’t even surprising. The same thing happened in the first year of each of the three deepest post-war stock market collapses: 2000-2002, 2007-2009, and 1973-74.
Specifically, from the March 24, 2000 bubble peak through March 9, 2001 (just under a year into that bear market, as today), the S&P 500 index lost only -19.3%. Similarly, from October 7, 2007 through September 19, 2008, in what was soon to be known as the global financial crisis, the S&P 500 lost just -19.8%. From January 11, 1973 market peak to January 2, 1974, the S&P 500 lost just -18.8%, amid a bear market that would ultimately take the stock market down by half”.
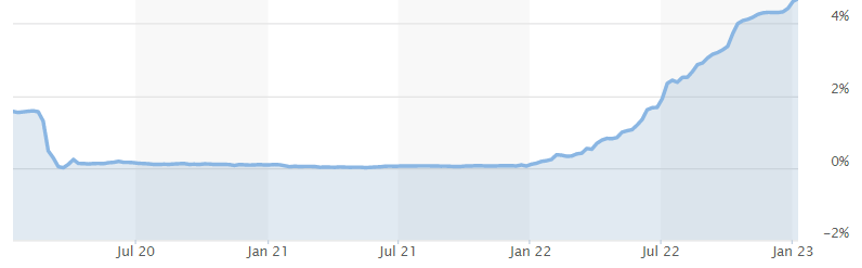
End of 40-year bear market in bond yields: The 90-day Treasury Bill peaked in 1980/81 at 16% and declined to near zero percent during the “great financial recession” of 2008. Rates remained near zero percent until they began moving dramatically higher in 2022. (See 3-month Treasury chart below.)
Confirmation / Validation of PCM’s tactical, rules-based approach to investing: Contrast the losses in the table (on first page), to PCM’s rules-based strategies, many of which were up or only down slightly for the year. As an example, I’ll list a few of our most used composites: PCM’s Absolute Bond Plus composite was up 1.83%. Our Liquid Reit composite was up 7.87%. PCM’s Absolute Bond was up 2.34%. Our Balanced composite was only down 4.16% and our Super Macro composite was down 3.83%. Your specific account and portfolio returns can be found on the performance statements enclosed.
I believe our safety first, rules-based approach will continue to be effective in navigating the ever-changing investment landscape. True diversification comes from having non-correlated investment strategies, which is how we have built your investment portfolios.
Housekeeping:
Great News! Because short term rates are dramatically higher than they have been in a decade, we can now earn you a current yield of 3 plus percent in a Schwab money market fund. You may see this in your accounts in lieu of the TD sweep account.
It is tax season:
- All capital gain/loss cost basis should now be contained on your TD / Schwab 1099’s.
- Drew will be happy to work with you or your tax preparer to ensure all needed documents are received.
Kindest Regards,
![]()

PCM's Strategy Dial Explained - Using Absolute Bond
Michael J. Chapman, CFP®, CIO
PCM Strategy Dial Explained: (PCM Absolute Bond Composite)
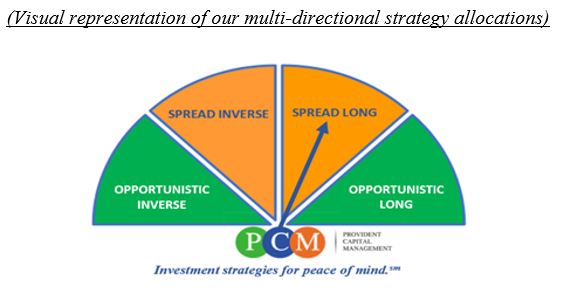
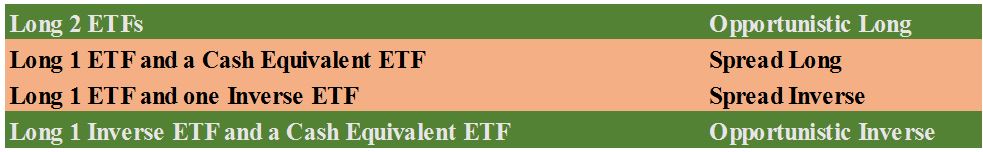
PCM’s Absolute Bond strategy is composed with up to two ETF’s allocated at the beginning of each month. The strategy invests in a proprietary allocation of ETFs, quantitatively selected from a basket of 8 ETF’s. These eight ETF’s provide exposure to: short, intermediate and long term US and International sovereign and corporate Bonds. The basket also includes ETF’s which provide exposure to various credit qualities and include an inflation protection ETF. Most importantly the basket contains a non-leveraged inverse ETF in order to provide potential protection and positive returns when rates are rising. The two ETF’s selected are given an equal weight of 50% each. Since there is only one “inverse” ETF in the basket, and given that there are two positons allocated each month, the most “Opportunistic Inverse” the strategy can be is 50% inverse and 50% cash equivalent. The most “Opportunistic long” the strategy can be is 100% (two 50% positions in various bond ETF’s). The possible combination of holdings can be broken down below:
Historic Perspective:
The US and many world sovereign bond markets have been in a long term, 30 plus year, bull market. The PCM Absolute Bond composite has a 9 year GIP compliant track record, during which time there has not been many opportunities to demonstrate how well the inverse ETF may potentially protect and enhance the return of the portfolio.
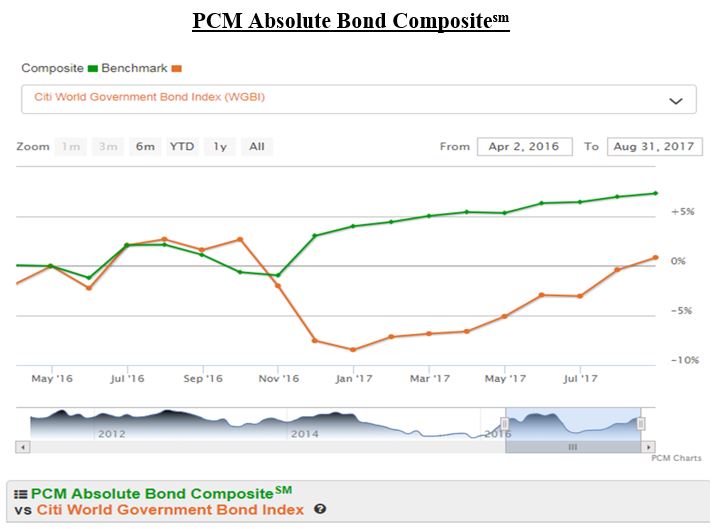
The bond markets did experience a sharp move up in rates (down in bonds) during the last quarter of 2016. Our PCM Absolute Bond strategy responded well, topping Informa’s performance list for both the fourth quarter of 2016 and for the entire year of 2016. The PCM Absolute Bond strategy moved to “Opportunistic Inverse” in November and December of 2016 resulting in a positive 5% return in our composite for the fourth quarter, versus an 8.5% decline in the Citi Corp Bond (Our benchmark). See chart below showing the monthly performance during the last quarter of 2016. Of course, past performance is no guarantee of future results. However, we believe that the performance of our Absolute Bond strategy during this period, illustrates the potential that our strategies can provide investors.
Superior full-market cycle returns are directly correlated to a reduction or elimination of large drawdowns in any given portfolio or investment strategy. To accomplish this an investment strategy must employ some form of risk management and should have the ability to capture positive returns in both rising and falling markets. Furthermore, it is important to have the ability to participate in all asset classes, all asset sizes and all asset styles across all markets to insure diversification that is truly non-correlated.
------------------------------------------------------------
Provident Capital Management, Inc. (PCM) is registered as an investment adviser with the State of Indiana, Securities Division. Registration does not constitute an endorsement of the firm by the State of Indiana nor does it indicate that the Adviser has attained a particular level of skill or ability. PCM claims compliance with the Global Investment Performance Standards (GIPS®). To receive a complete list and description of the firm's composites and/or a presentation that adheres to the GIPS® standards, please contact the firm at the address listed.
Michael J. Chapman, CFP®, CIO
It’s been several years since investors lost billions in the Bernie Madoff Ponzi scheme. Despite historical increases in industry regulation and oversight, we continue to read and hear of new scams and lost fortunes, proving no government agency can foolproof your investments against fraud. Fortunately, there is one important thing all investors can do to minimize potential exposure and protect themselves: Separate who’s managing your money from the custodian holding your money.
Having been in the financial industry for over 30 years, I am certain that adding an experienced and competent financial advisor to your team is well worth the incremental cost by allowing you to avoid the many pitfalls inherent in investing. Having said that, I am equally certain your advisor should have limited authority over your assets. These authorized activities should be restricted to:
The buying and selling of securities on your behalf and transferring your funds, but only into an account with the same title and ownership. These permissions and restrictions can be accommodated by signing a limited power of attorney. Ensure the investment account your advisor manages is not held at the advisor’s company. Said a different way, the company you write your checks to and that custodies your assets should not be the same company that is managing your money.
The custodian will provide a monthly or quarterly statement showing all of the activity in your account. A good money manager will provide you with performance statements, usually on a quarterly basis, which gives you two different statements from two different sources to compare. You now have a system of checks and balances to ensure your funds are exactly where you believe them to be, in the amount you believe there to be.
Let the Investor Beware.
In the case of Madoff and so many like him, the manager was furnishing fabricated statements and it was not until it was too late that the investors discovered their money was long gone. This would not have been possible if their funds had been deposited at a separate custodian, whereas Madoff was simply given the power to invest those funds. He could not have used the funds to pay off other investors in his Ponzi scheme if a separate custodian had been used. Additionally, the custodian’s monthly statements would have reflected his true dismal performance.
Most registered investment advisors (RIAs) do not hold or custody client funds. Instead, they have a contract that allows them to buy and sell securities on their clients’ behalf and to move funds from one account to another, as long as they are titled in the same name. Keep these things in mind:
Some RIAs will act as the money manager for your accounts, but again, your accounts are held at a different custodian.
My firm, Provident Capital Management, Inc. (PCM) uses discount brokerage firms such as TD Ameritrade and Charles Schwab to hold client assets. Each month you receive a statement from the discount broker and each quarter a performance statement from PCM. It is in your best interest to compare the ending balances on these two statements. If the balances don’t match, then you know further research is needed. An additional benefit of this type of arrangement is the custodians mentioned above offer 24/7 viewing of your accounts online, which means you could monitor your funds daily. As a registered investment advisor, we operate this way to add an additional check and balance to protect you as the consumer.
Greed, fear, fraud and deceit have been around throughout our history. Human nature has not varied much over the ages. Despite modern advances in finance, monetary policies and investment options, we still continue to see asset bubbles and watch investors chase too-good-to-be-true investment returns, only to lose a great deal of money. However, risk of losing money extends beyond the gains or losses in stocks or bonds. The first step to take in protecting yourself from fraud is to separate who’s holding and reporting your money from who is managing it.
PCM Strategy Dial 11-01-2020 Explained Using PCM U.S. Industries Total Return
Michael J. Chapman, CFP®, CIO
PCM Strategy Dial Explained: (PCM U.S. Industries Total Return)
PCM’s US Industries is composed with up to four ETF’s allocated at the beginning of each month. The strategy invests in a proprietary allocation of ETFs quantitatively selected from among 23 U.S. industry sectors and 2 “inverse” ETFs, the inverse Dow Jones Industrial Average and the inverse S&P 500. The four ETF’s selected are given an equal weight of 25% each. Since there are only two “inverse” ETFs in the basket and given that there are four positons allocated each month, the most “Opportunistic Inverse” the strategy can be is 50% inverse and 50% cash. The most “Opportunistic long” the strategy can be is 100% (four 25% positions in various US Industries). The possible combination of holdings can be broken down as follows:
| Allocation | Strategy |
|---|---|
| Long 3 or 4 ETFs | Opportunistic Long |
| Long 1 or 2 ETFs and Cash Equivalent | Spread Long |
| Long 1 or 2 ETF and Cash plus one Inverse | Spread Inverse |
| Long 0 ETF's and Cash plus two Inverse ETFs | Opportunistic Inverse |
Historic Perspective:
Given the fact that we have been in a generally rising market since March of 2009, it is not surprising that the strategy has resulted in a high percentage of the time being “Opportunistic Long” or “Spread Long”. When we review our strategy during the last serious bear market of October 2007 through March of 2009, the strategy first moved into a “Spread Inverse” position in the month of December 2007 and, with only two exceptions, remained “Opportunistic Inverse” or “Spread Inverse” through the end of the bear market in March of 2009.
While allocations in our PCM US Industries ETF strategy tend to be trend following, it has historically reacted quickly to a change in trend direction. During the October 2007 to March 2009 bear market it moved to a “Spread Inverse” allocation on December 01, 2007 and then back to a “Spread Long” allocation on March 01, 2009. We have received various requests to provide a visual tool that may help further explain how our multi-directional strategies work. We believe the “PCM Strategy Dial” will be a helpful tool when discussing our strategies with your clients and prospects. Our “PCM Strategy Dial” will help illustrate in which of the four directional strategy positions our strategies are invested. Additionally, our PCM Strategy Dial will also be available on our website at www.pcminvestment.com.
Superior full-market cycle returns are directly correlated to a reduction or elimination of large drawdowns in any given portfolio or investment strategy. To accomplish this an investment strategy must employ some form of risk management and should have the ability to capture positive returns in both rising and falling markets. Furthermore, it is important to have the ability to participate in all asset classes, all asset sizes and all asset styles across all markets to insure diversification that is truly non-correlated.
------------------------------------------------------------
Provident Capital Management, Inc. (PCM) is registered as an investment adviser with the State of Indiana, Securities Division. Registration does not constitute an endorsement of the firm by the State of Indiana nor does it indicate that the Adviser has attained a particular level of skill or ability. PCM claims compliance with the Global Investment Performance Standards (GIPS®). To receive a complete list and description of the firm's composites and/or a presentation that adheres to the GIPS® standards, please contact the firm at the address listed.
Michael J. Chapman, CFP®, CIO
Any loss sustained in one’s portfolio requires a greater return to get back to the original starting point. A twenty percent loss will require a twenty five percent return on remaining principal to get back to the starting value. For example, look at these two hypothetical situations first from a rebounding market and a then from a declining market.
Rebounding from a market decline: $100,000 starting value - 37.6% cumulative decline You will need a 60% return to get back to $100,000
Approaching retirement, look what happens when withdrawals are taken during a market decline: $100,000 starting value 5% withdraw rate each year for retirement - 37.6% cumulative decline. You will need a 87% return to get back to $100,000 if you take a 5% withdraw.

Page 1 of 2